Mario Malić
My name is Mario and I am a mechanical engineer with hands-on experience in noise and vibrations, finite element analysis, and software development. Currently, I work at VIBES.technology in Delft as a solution engineer, applying NVH testing and modelling methods to automotive components and delivering insights to customers. On the customer success side, I handle technical support, troubleshoot issues, and work directly with clients to make sure they get value from the software. Beyond that, I enjoy build tools that connect physical testing with numerical simulations, automate repetitive engineering workflows, and turn raw data into useful results.
This site is a collection of projects that give a better picture of what I can do. Browse through them below.
Noise, vibrations and simulation
Modal and experimental modal analysis of insulation floors
Figure 1. Simulated mode shape
|
Figure 2. Measured mode shape
|
Structural vibration from ship machinery propagates through the floors to passengers on board. This project builds a finite element model of an insulation floor, runs experimental modal analysis on the real structure, and validates the two against each other — natural frequencies, mode shapes, and damping — achieving less than 5% difference across the first six vibration modes. A good example of the full NVH workflow: model, measure, compare, refine.
Deep drawing process optimization
Figure 3. FE simulation of the deep drawing process
|
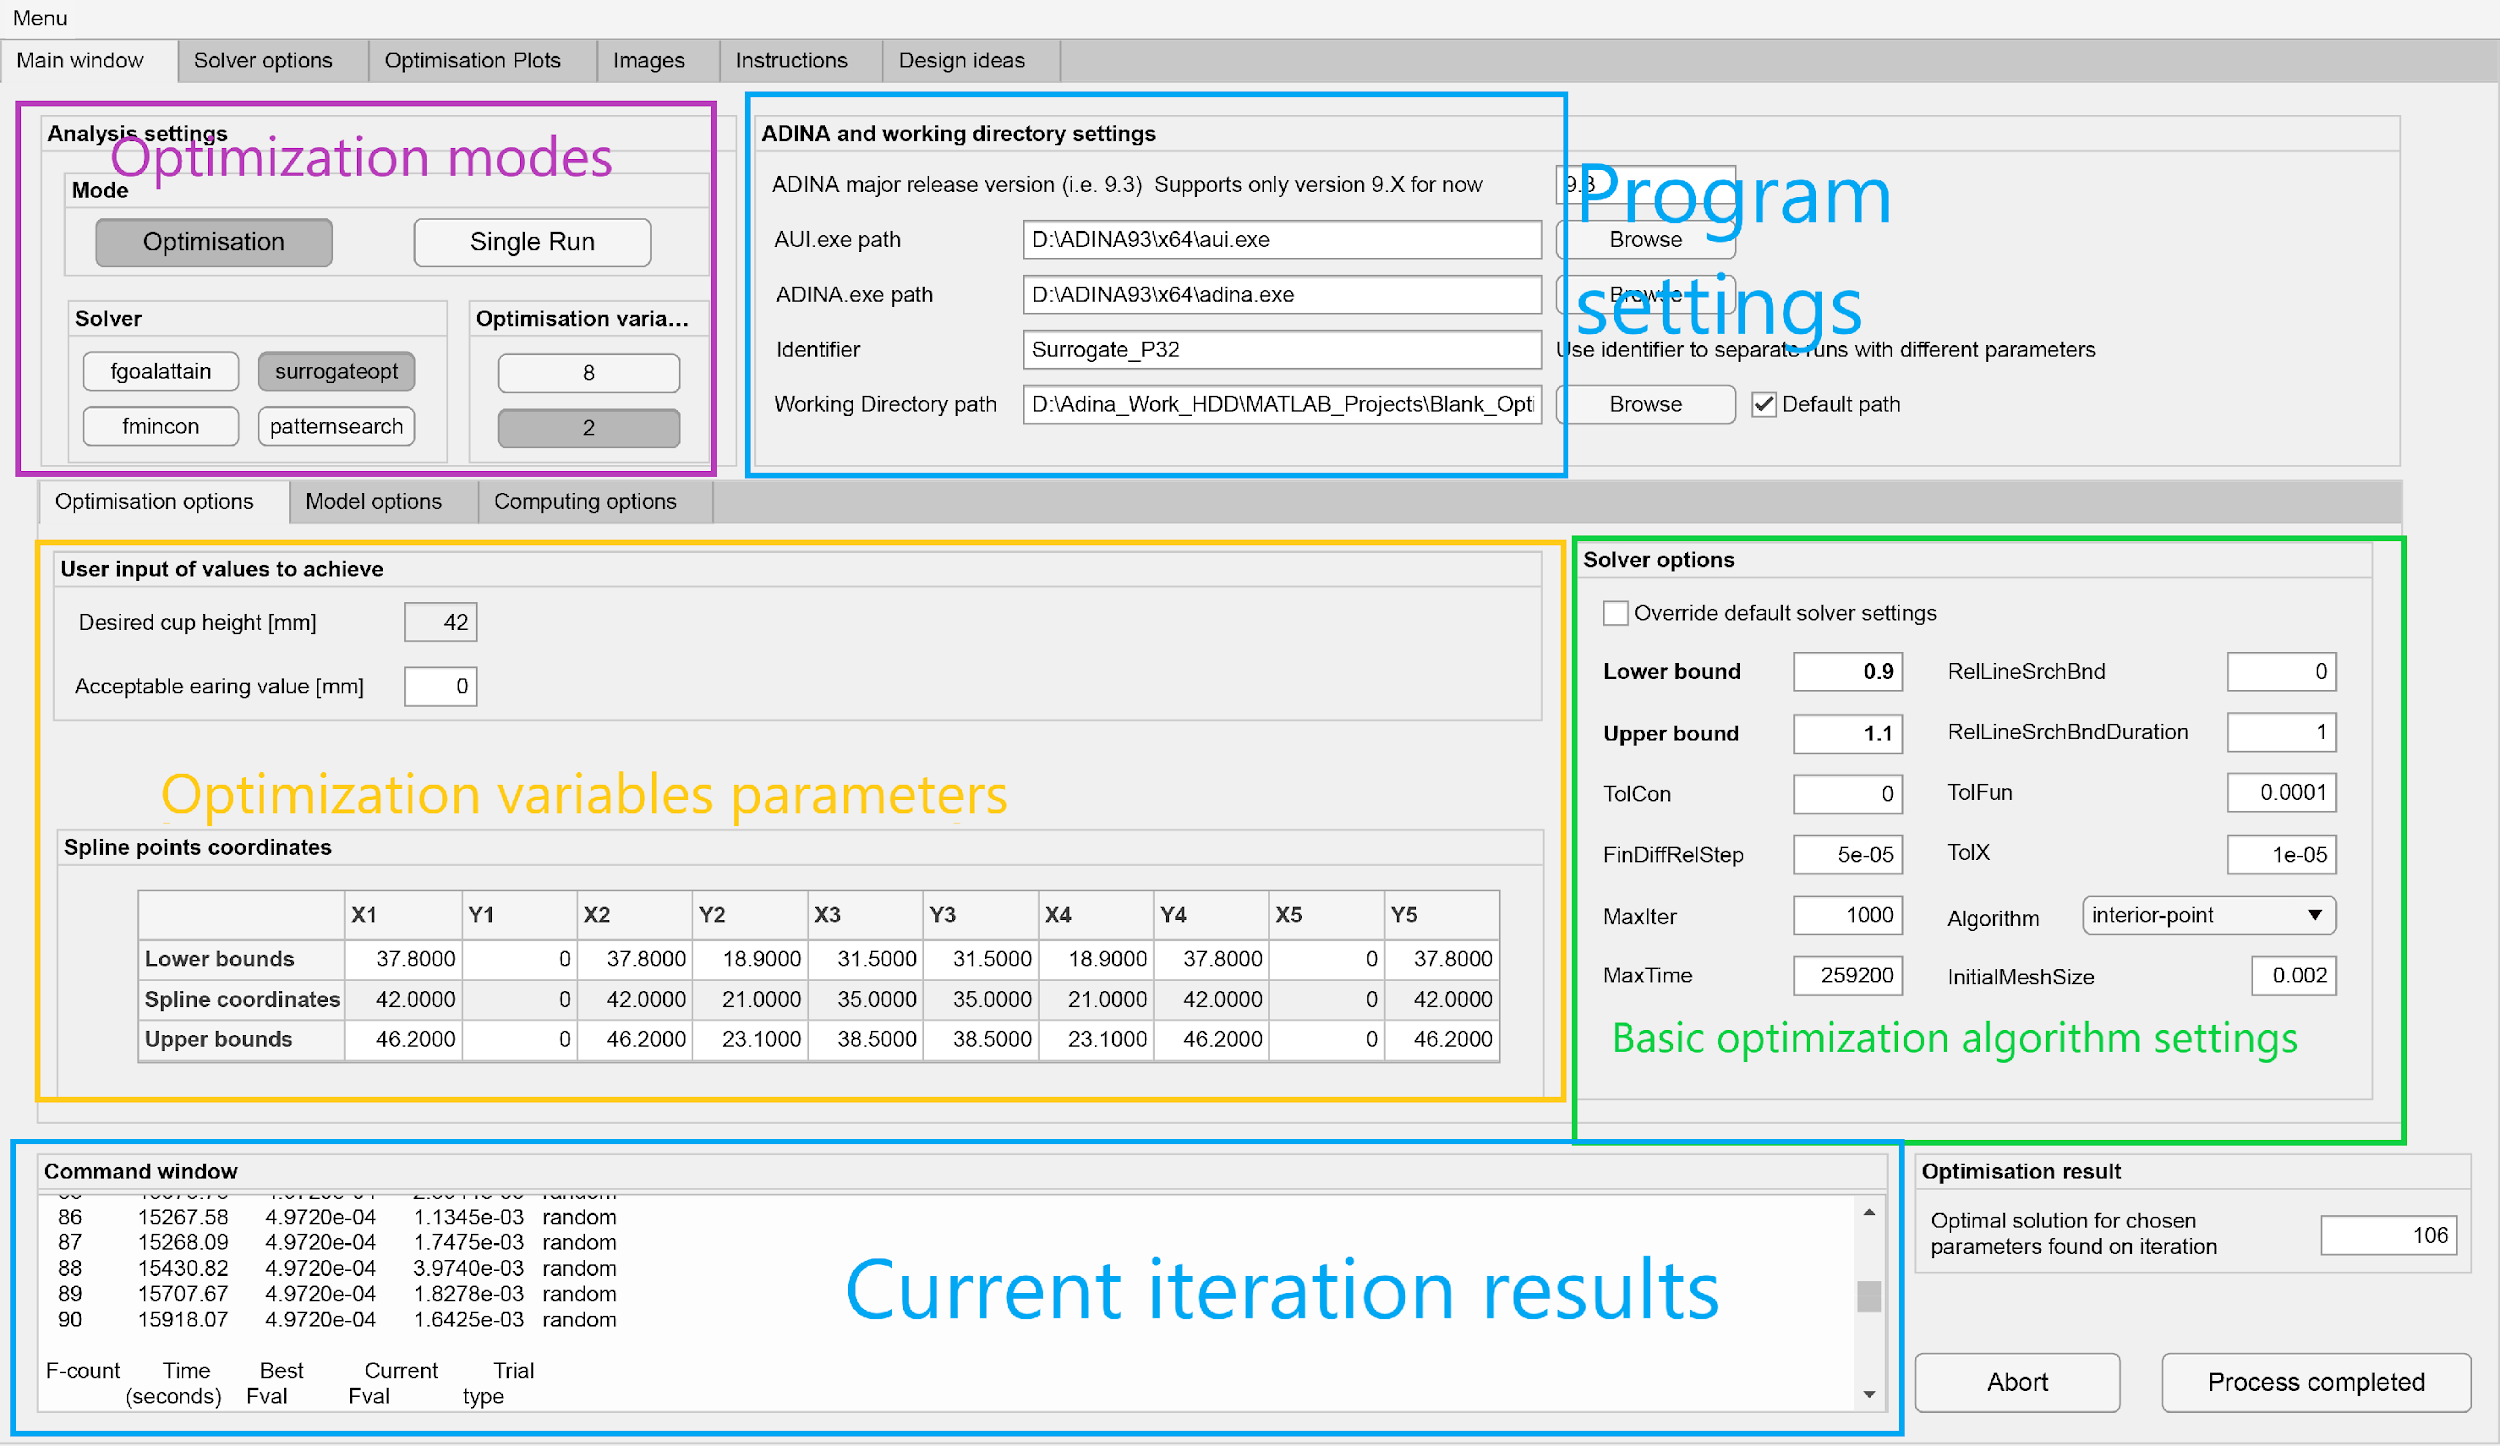
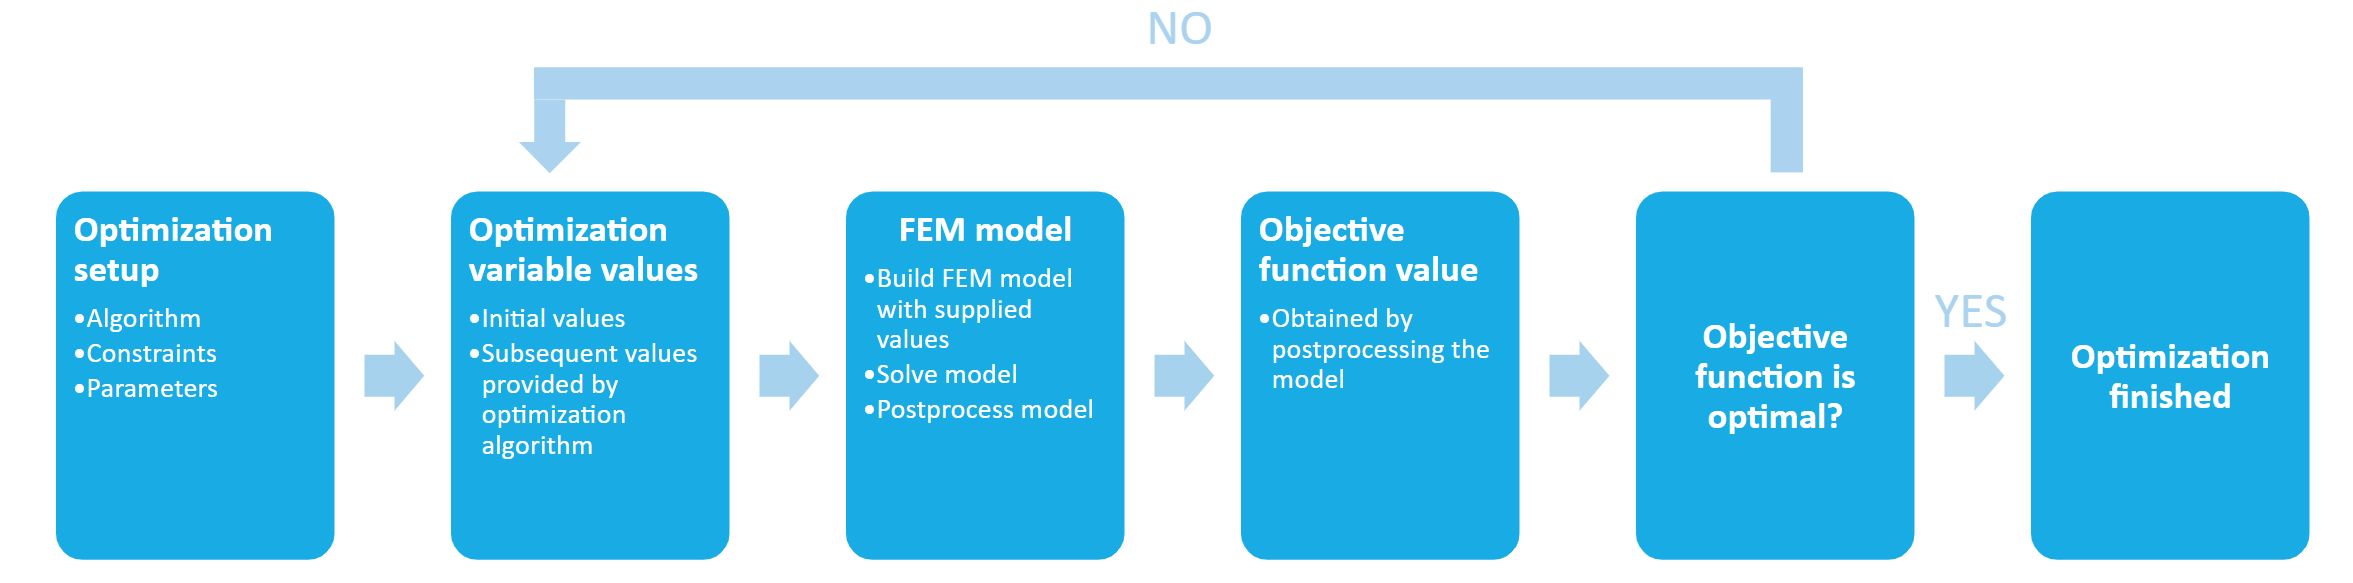
Figure 4. Optimization tool UI
|
Sheet metal has a directional memory from rolling, which causes uneven deformation when it is drawn into a cup shape — a defect called earing. Trimming it away wastes material and adds cost. This project attacks the problem from the other end: instead of fixing the defect after forming, it optimizes the initial blank shape so the earing never appears.
The result is a MATLAB app that drives a parameterized FE model through an optimization loop, automatically adjusting a B-spline blank contour until flange height variation is minimized. Single- and multi-objective optimization, parallel computation support, and a full set of per-iteration results are all built in.
Software and automation
DAQx
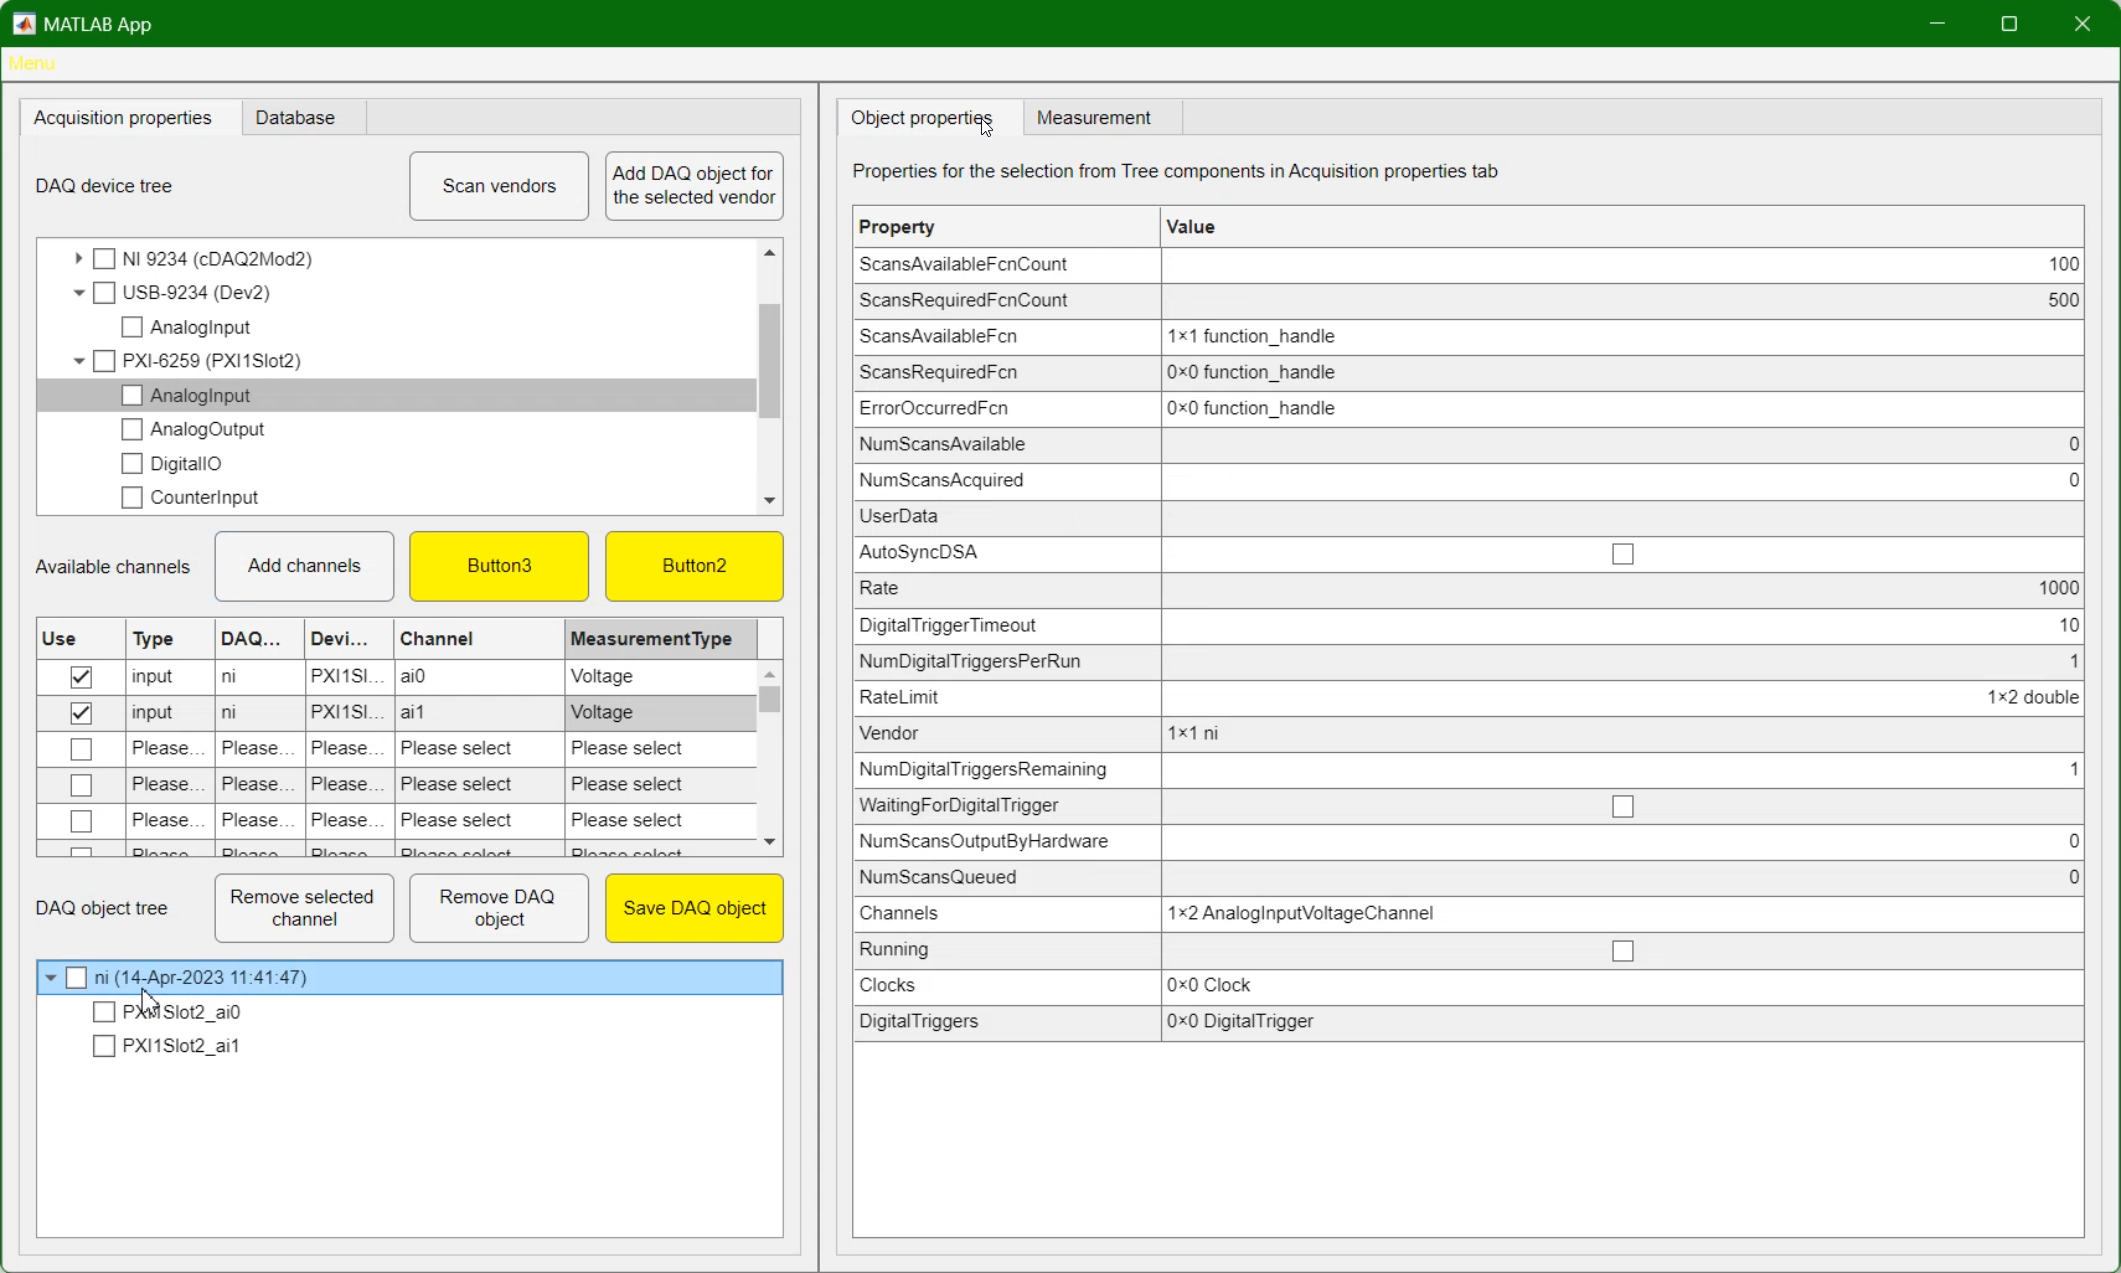
Figure 6. DAQ configuration window
|
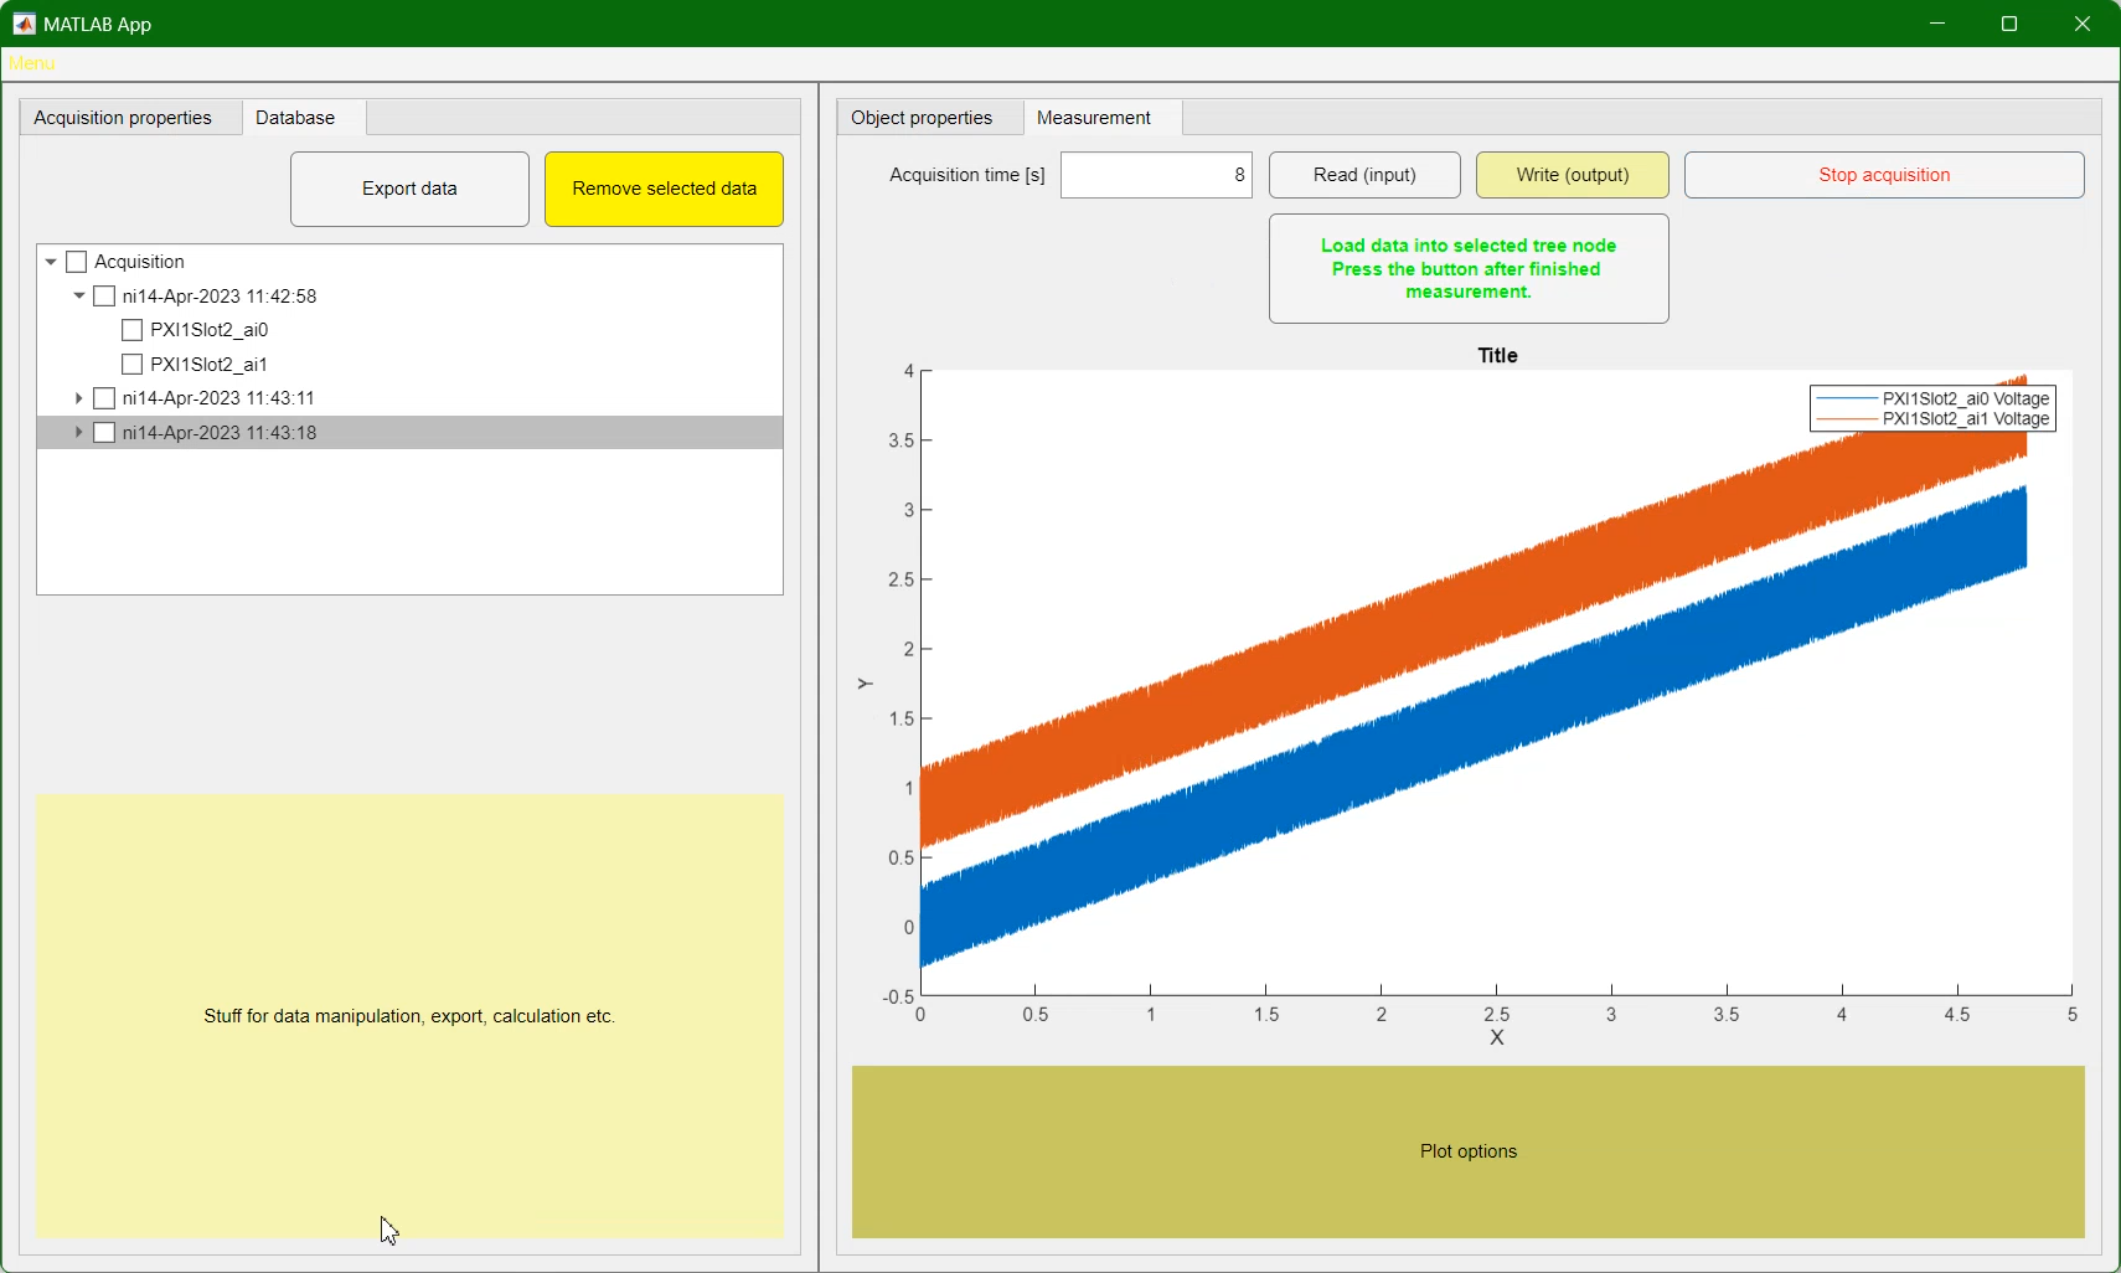
Figure 7. Acquired data (simulated device)
|
Setting up a data acquisition session should not require opening LabVIEW or writing MATLAB scripts from scratch every time. DAQx is a MATLAB GUI application that handles the full acquisition workflow with NI DAQ hardware — device selection, channel configuration, real-time visualization, and data export — with no coding required from the user.
Image to ADINA
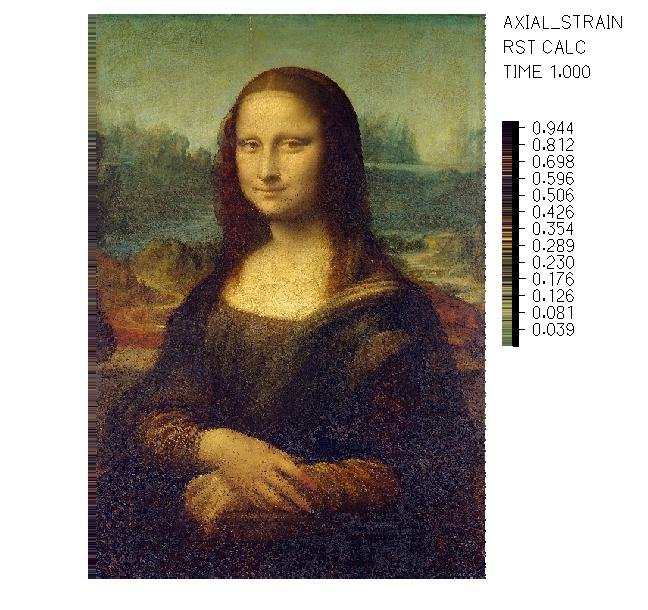
A fun one. This script takes any image and generates a script-based finite element input file: a 2D grid of truss elements where each truss has a prescribed displacement, and a custom colormap maps the resulting deformation field back to the RGB values of the original pixels. The output, when post-processed in ADINA, reproduces the original image as a strain plot. Built to demonstrate what is possible with script-based FE modelling and a solid understanding of how the solver works.
SolidWorks automation example
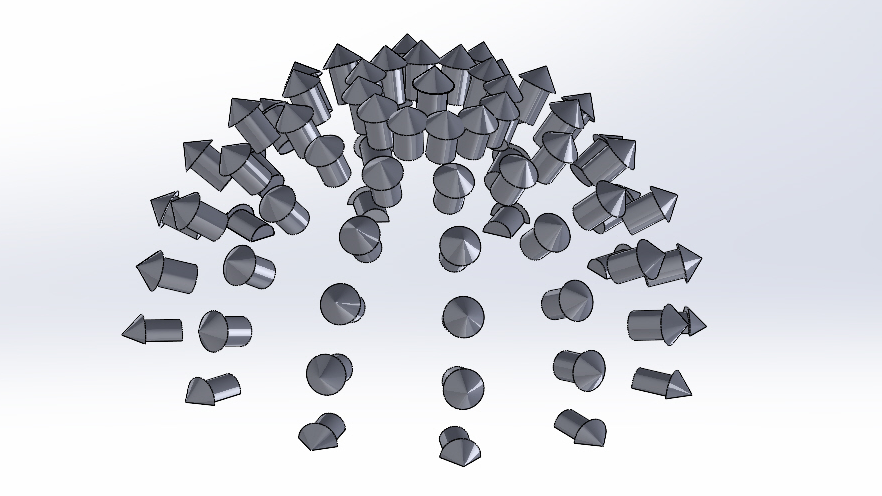
Another fun project, this time on the CAD side. An Excel file defines arrow dimensions and hemisphere parameters. A MATLAB script reads those inputs, computes the position and orientation of each arrow distributed across a half-hemisphere, and writes the results back to Excel. A SolidWorks VBA macro then reads that file, creates the arrow part with the correct dimensions, and builds the full assembly with every arrow placed in the right position and pointing outward, normal to the surface. No manual placement needed.
Hardware
Cable organizer
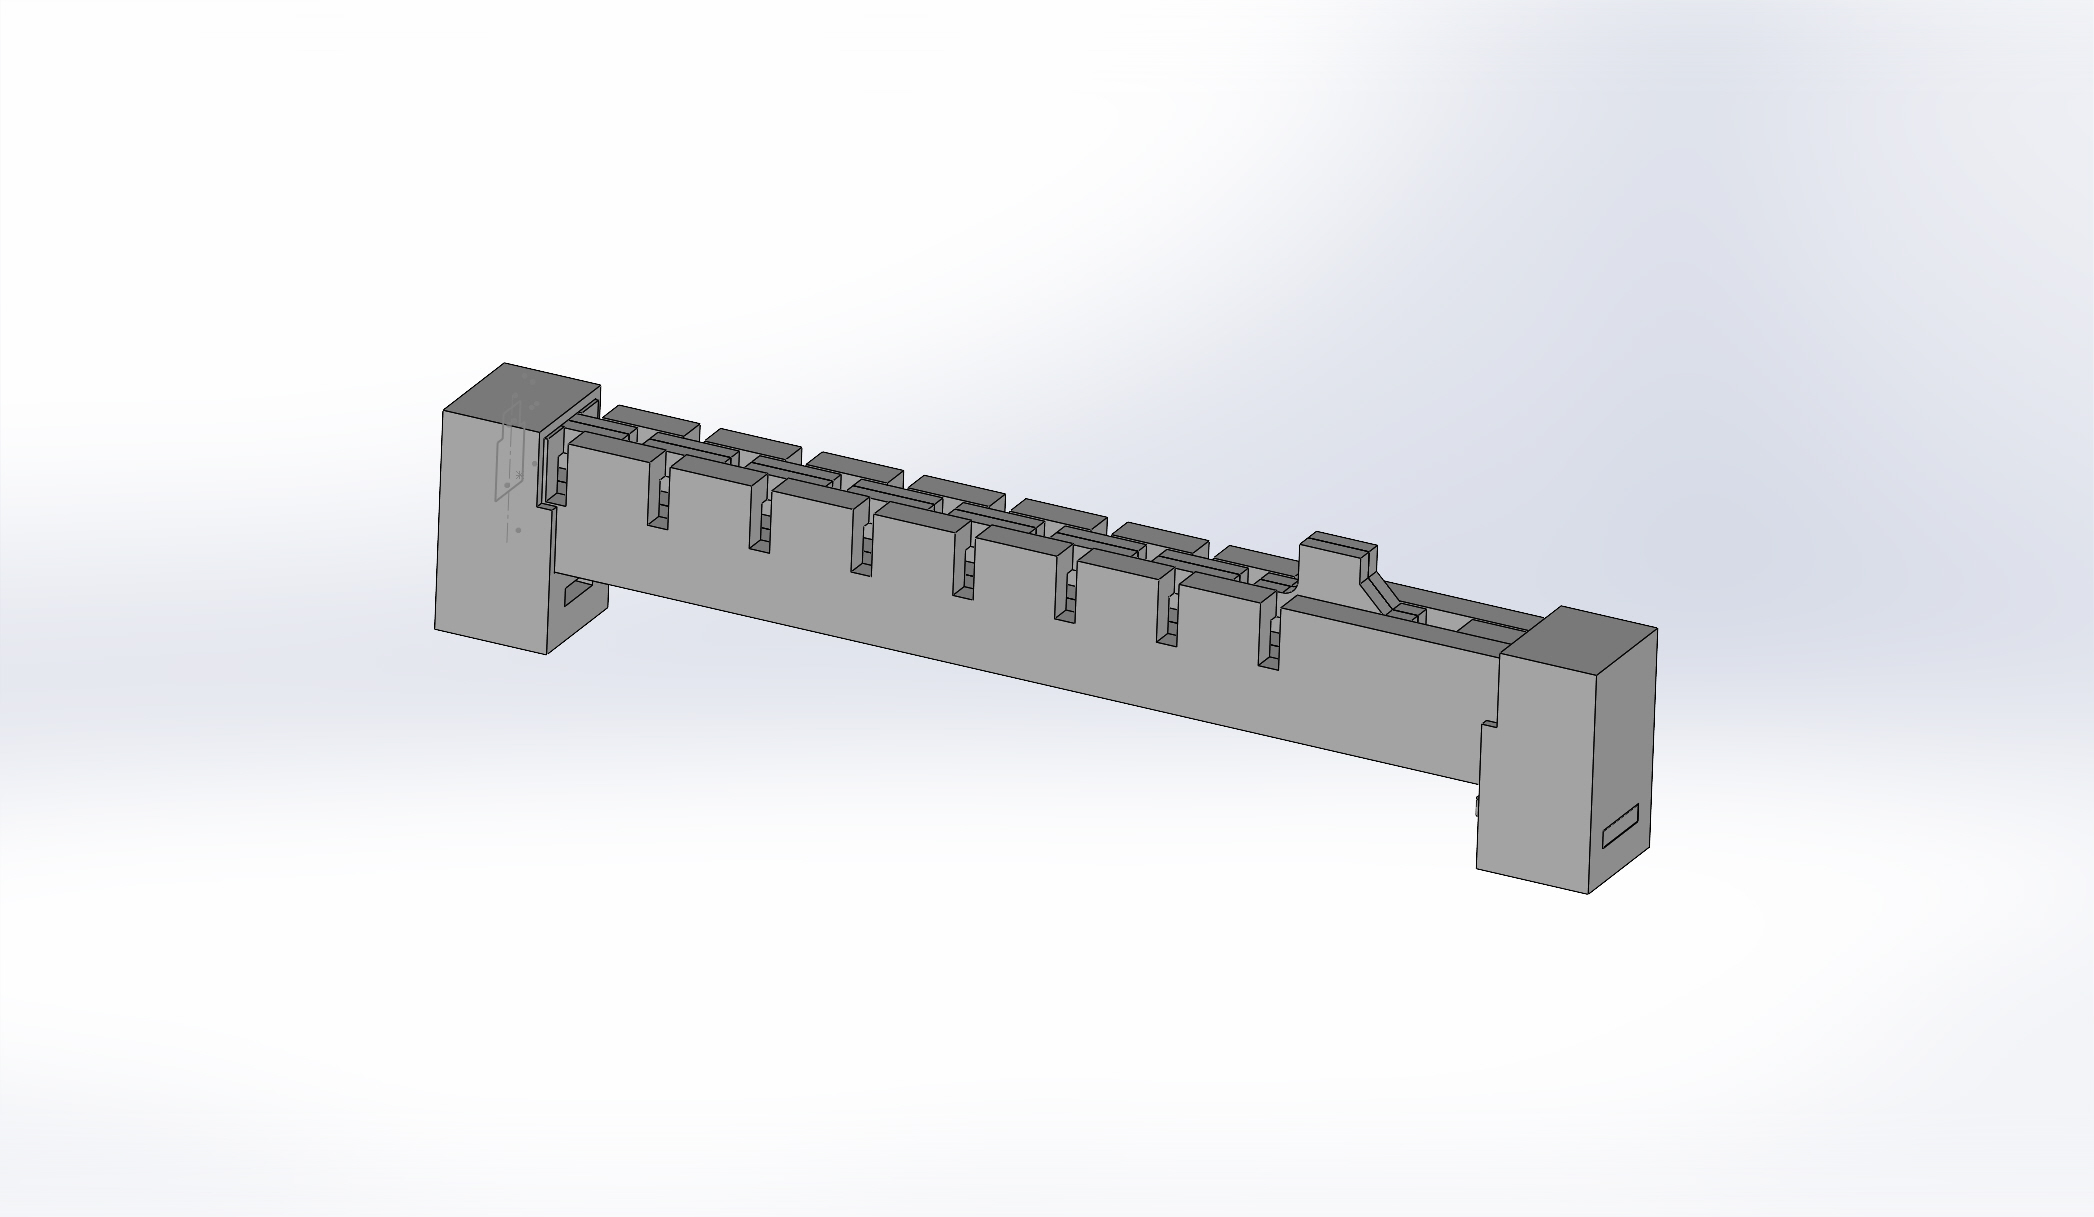
Figure 10. Side view
|
Figure 11. Opened and closed state
|
If you have run NVH measurements, you know the chaos that cable management becomes once sensors are attached and the test is live. This 3D printed tool holds cables in labeled slots, lets you prepare the full setup before connecting to the acquisition system, and attaches to any ferromagnetic surface with built-in magnets. Small project, but it solves a real problem.
This website
My website
This site is built with AsciiDoc and Antora — the same stack used for professional software documentation, adapted here for a personal portfolio. Content is written in plain text markup, Antora assembles and publishes it as a static site, and small CSS and Handlebars customizations adjust the default theme. It is not flashy, but it is fast, easy to maintain, and open source.